GWT Widget Library
Friday, June 09, 2006
JsGraphics coming in 0.0.4
If you haven't heard of JsGraphics, it is a drawing library that is compatible with a wide range of browsers, even very old browsers like Netscape 4.x and IE 4.x.
Version 0.0.4 of the library will include a wrapper for JsGraphics which will hopefully allow for charting packages and such to be built on top of it.
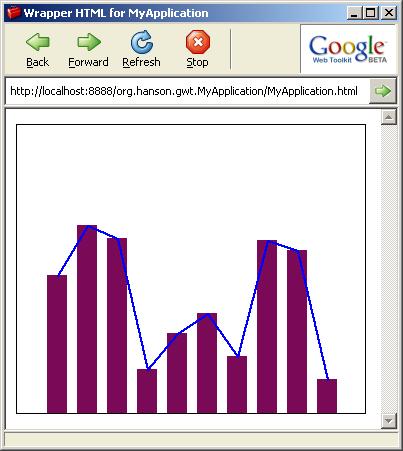
To give you a sampling of the API, here is a screenshot and sample code to build a bar and lioine chart.

The way the JavaScript library is set up makes it difficult to allow you to uild the widget and add it to RootPanel. Instead you need to create the JsGraphicsPanel from an existing HTML element in the page by passing the ID of the DIV element.
Here is the HTML that was used for the example above:
<html>
<head>
<title>Wrapper HTML for MyApplication</title>
<script src="script/wz_jsgraphics.js" type="text/javascript"></script>
<meta name='gwt:module' content='org.hanson.gwt.MyApplication' />
</head>
<body>
<script language="javascript" src="gwt.js"></script>
<div style="border:1px solid #000;overflow:hidden;width:350px;height:290px;"><div id="g"></div></div>
</body>
</html>
I am hoping to release this on Monday, along with some other utilities such as converting from Java to JavaScript arrays, and some small bug fixes.
Version 0.0.4 of the library will include a wrapper for JsGraphics which will hopefully allow for charting packages and such to be built on top of it.
To give you a sampling of the API, here is a screenshot and sample code to build a bar and lioine chart.

public void onModuleLoad ()
{
    JsGraphicsPanel p = new JsGraphicsPanel("g");

    int[] data = new int[]{150, 200, 187, 56,
            92, 112, 69, 185, 175, 46};

    int[] xPoints = new int[data.length];
    int[] yPoints = new int[data.length];

    for (int i = 0; i < data.length; i++) {
        int val = data[i];

        p.setColor(new Color(122, 10, 87));
        p.fillRect(i * 30 + 30, 300 - val, 20, val);

        xPoints[i] = i * 30 + 40;
        yPoints[i] = 300 - val;
    }

    p.setColor(Color.BLUE);
    p.setStrokeWidth(2);
    p.drawPolyline(xPoints, yPoints);
    p.paint();
}
The way the JavaScript library is set up makes it difficult to allow you to uild the widget and add it to RootPanel. Instead you need to create the JsGraphicsPanel from an existing HTML element in the page by passing the ID of the DIV element.
Here is the HTML that was used for the example above:
<html>
<head>
<title>Wrapper HTML for MyApplication</title>
<script src="script/wz_jsgraphics.js" type="text/javascript"></script>
<meta name='gwt:module' content='org.hanson.gwt.MyApplication' />
</head>
<body>
<script language="javascript" src="gwt.js"></script>
<div style="border:1px solid #000;overflow:hidden;width:350px;height:290px;"><div id="g"></div></div>
</body>
</html>
I am hoping to release this on Monday, along with some other utilities such as converting from Java to JavaScript arrays, and some small bug fixes.
Comments:
<< Home
hi
im DALi from Tunisia
im trying to use GWT to make a small graph editor
i want to use JsGraphics
i added jsgraphics.js
and all resquired lines in html file
but when i run
thers is a bug
the IMPORT ORG CAN NOT BE RESOLVED
please help me if u know the reoson
thank you
im DALi from Tunisia
im trying to use GWT to make a small graph editor
i want to use JsGraphics
i added jsgraphics.js
and all resquired lines in html file
but when i run
thers is a bug
the IMPORT ORG CAN NOT BE RESOLVED
please help me if u know the reoson
thank you
Hi Robert!
I tried to use a JsGraphicsPanel
within a GWT dialog box.
I got the following exception:
org.gwtwidgets.client.wwrapper.ElementNotFoundException: ID:g
at org.gwtwidgets.client.wrap.JsGraphicsPanel.init(JsGraphicsPanel.java:77)
Obviously the JsGraphicsPanel tries to find the appropriate div id="g", but fails since the code is not part of the master HTML page, but part of the diaolg box's HTML. Is there a decent way to use the panel inside a dialog? Thanks in advance for your help! Bernd
Post a Comment
I tried to use a JsGraphicsPanel
within a GWT dialog box.
I got the following exception:
org.gwtwidgets.client.wwrapper.ElementNotFoundException: ID:g
at org.gwtwidgets.client.wrap.JsGraphicsPanel.init(JsGraphicsPanel.java:77)
Obviously the JsGraphicsPanel tries to find the appropriate div id="g", but fails since the code is not part of the master HTML page, but part of the diaolg box's HTML. Is there a decent way to use the panel inside a dialog? Thanks in advance for your help! Bernd
<< Home

